
Apple, Microsoft, and Nvidia Are Lagging—But 65% of Stocks Are Beating the Index
The turbulence under the surface - a deep dive.

Relax. No, it's not a seismograph announcing an earthquake. But it might be telling us something just as important.
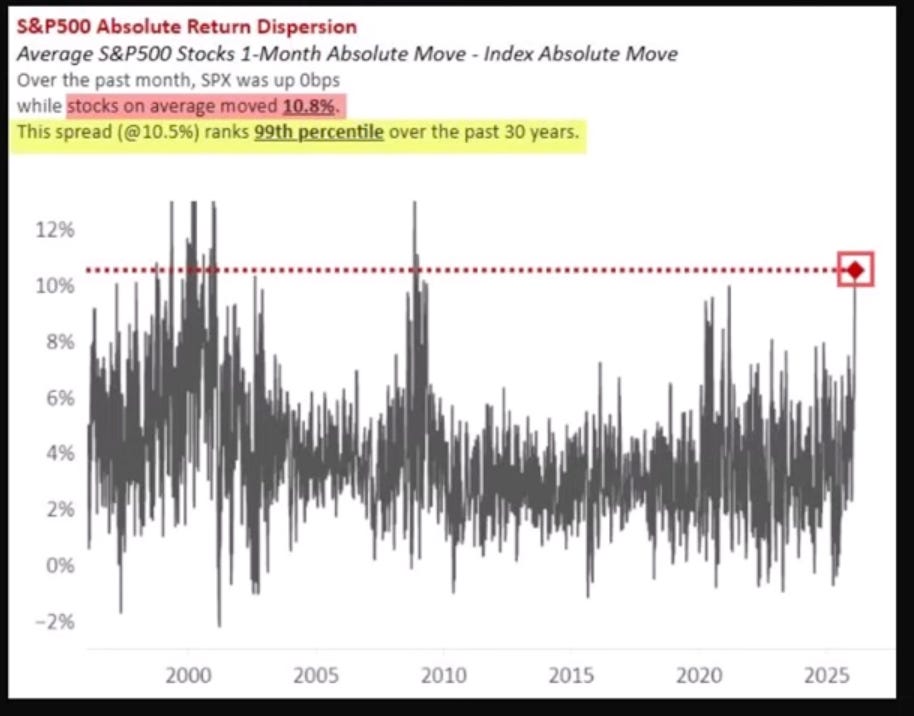
The S&P 500 went nowhere last month — zero. But the average stock inside it moved 10.8%. That gap, at the 99th percentile over 30 years, tells you something important: the index is calm, but beneath the surface, individual stocks are moving violently in opposite directions. Here's what that means — and what it doesn't.
The stock market,S&P 500 in this case, is doing something unusual. Two things that don’t normally happen together are happening at the same time.
First, more stocks are going up than going down. When we count all the stocks on the New York Stock Exchange and compare winners to losers each day, the winners are piling up. This measure just hit an all-time high on 4 February 2026. Normally, this is a sign of a healthy market where lots of companies are participating in the gains.
But here’s the strange part: we’re also seeing a lot of stocks hit their lowest prices of the year at the same time that others hit their highest. This mixed signal has a name—the Hindenburg Omen—and it suggests that beneath the surface, stocks are moving in very different directions. Some are thriving while others are struggling, all at once. ImGeld’s recent breadth analysis explores this dynamic in more detail.
Why does this matter? Because it tells us that “the market” isn’t moving as one. Different parts are doing very different things. Understanding this can help you think more carefully about where your money sits and whether you’re comfortable with that.
What the Numbers Are Telling Us
Let’s break down what’s actually happening with some concrete examples.
The big names are lagging. You’ve probably heard of companies like Apple, Microsoft, Amazon, and Nvidia—the giant technology companies that led the market higher over the past few years. Right now, most of them are struggling. On average, these former leaders are down more than 15% from their highest prices. Only one of the seven biggest names is still keeping pace with the broader market.
The average stock is doing better than the index. Here’s something that might seem confusing at first: the S&P 500 (the most famous measure of US stocks) is basically flat this week, but the average stock in that same index is actually doing quite well. How is that possible?
It comes down to how the index is built. The S&P 500 gives more weight to bigger companies. So when Apple or Microsoft falls, it drags down the whole index, even if hundreds of smaller companies are rising. Right now, about 65% of the stocks in the S&P 500 are actually beating the index—one of the best readings in fifty years.
Different industries are taking the lead. The companies doing well right now aren’t the technology giants. Instead, it’s industries like manufacturing, energy, mining, and basic consumer goods. These are sometimes called “old economy” businesses—companies that make physical things, dig resources out of the ground, or provide essential everyday products. As ImGeld’s sector rotation note observed, this shift has been building for several weeks.
What This Means for Your Money
This section is about asking yourself some questions—not about telling you what to do.
Where is your money actually invested? If you own an S&P 500 index fund (a very common investment), a large chunk of your money is tied to those big technology companies we mentioned—even though they’re currently lagging. This isn’t necessarily bad, but it’s worth knowing. Your investment might behave differently than “the market” you hear about on the news.
Are you comfortable with that mix? There’s no right or wrong answer here. Some people are happy to stick with large technology companies because they believe in them long-term. Others might prefer a more even spread across different types of businesses. The important thing is that you understand what you own and feel comfortable with it.
How would you feel if this continues? Imagine the current pattern continues for another few months: the big technology names keep lagging while industrial and energy companies keep leading. Would you be tempted to sell your technology holdings and buy what’s been working? Would you panic? Would you do nothing? Thinking about this in advance can help you make calmer decisions later.
How often do you check your investments? In a market like this one, where different parts are moving in different directions, checking prices every day might make you anxious without giving you useful information. Deciding in advance how often you’ll review your investments—and sticking to that schedule—can help you avoid reacting emotionally to short-term moves.
Common Mistakes to Avoid
When markets behave like this, certain mistakes become more tempting. Being aware of them can help you avoid them.
Chasing what just went up. When you see that energy stocks or industrial companies have been rising, it’s natural to want to buy them. But by the time a trend is obvious, much of the move may have already happened. Buying after something has risen significantly means you’re paying higher prices and taking on more risk if the trend reverses.
Selling what just went down. The opposite mistake is equally common. Technology stocks are lagging right now, which might make you want to sell them. But selling after a decline locks in your losses. Unless something fundamental has changed about why you own those investments, short-term underperformance alone isn’t necessarily a reason to sell.
Treating warning signs as certainties. That Hindenburg Omen signal we mentioned earlier? It’s appeared many times throughout market history. Sometimes it preceded real trouble. Other times, the market shrugged it off and kept rising. It’s a piece of information, not a prediction. ImGeld’s volatility note discusses how to interpret these signals without overreacting. Treat it as one data point among many, not as a reason to make dramatic changes.
Believing compelling stories. Right now, you can find convincing arguments that technology is finished and industrial companies will lead for years. You can also find equally convincing arguments that technology will bounce back and regain leadership. The truth is that nobody knows for certain. Be sceptical of anyone—including yourself—who sounds too confident about what comes next. This piece on trading without a framework explores why process matters more than conviction.
The Bottom Line
The market right now is giving mixed signals. Some measures look healthy. Others suggest fragmentation beneath the surface. Different types of companies are moving in very different directions.
This isn’t a situation that requires you to do something. It’s a situation that invites you to think about your investments:
Do you understand what you own?
Are you comfortable with how it’s spread across different types of companies?
Have you thought about how you’d react if current trends continue—or reverse?
Markets go through periods like this regularly. The companies leading the way change over time. What rarely changes is that patient, thoughtful investors who understand their own holdings tend to do better than those who react emotionally to short-term moves.
The goal isn’t to predict what happens next. It’s to position yourself in a way that you can stick with through different conditions—and to make decisions from a place of understanding rather than anxiety.
Learn More
If you’d like to explore these concepts further, here are some trustworthy resources:
NYSE Market Data – https://www.nyse.com/market-data/daily-market-statistics
S&P 500 Index Explained – https://www.spglobal.com/spdji/en/indices/equity/sp-500/
Investor Education from the SEC – https://www.investor.gov/introduction-investing
Federal Reserve Economic Data – https://fred.stlouisfed.org/