40
US industries ranked every trading day, the full Industry Heat Map universe.
Helping 5,000+ investors research with confidence
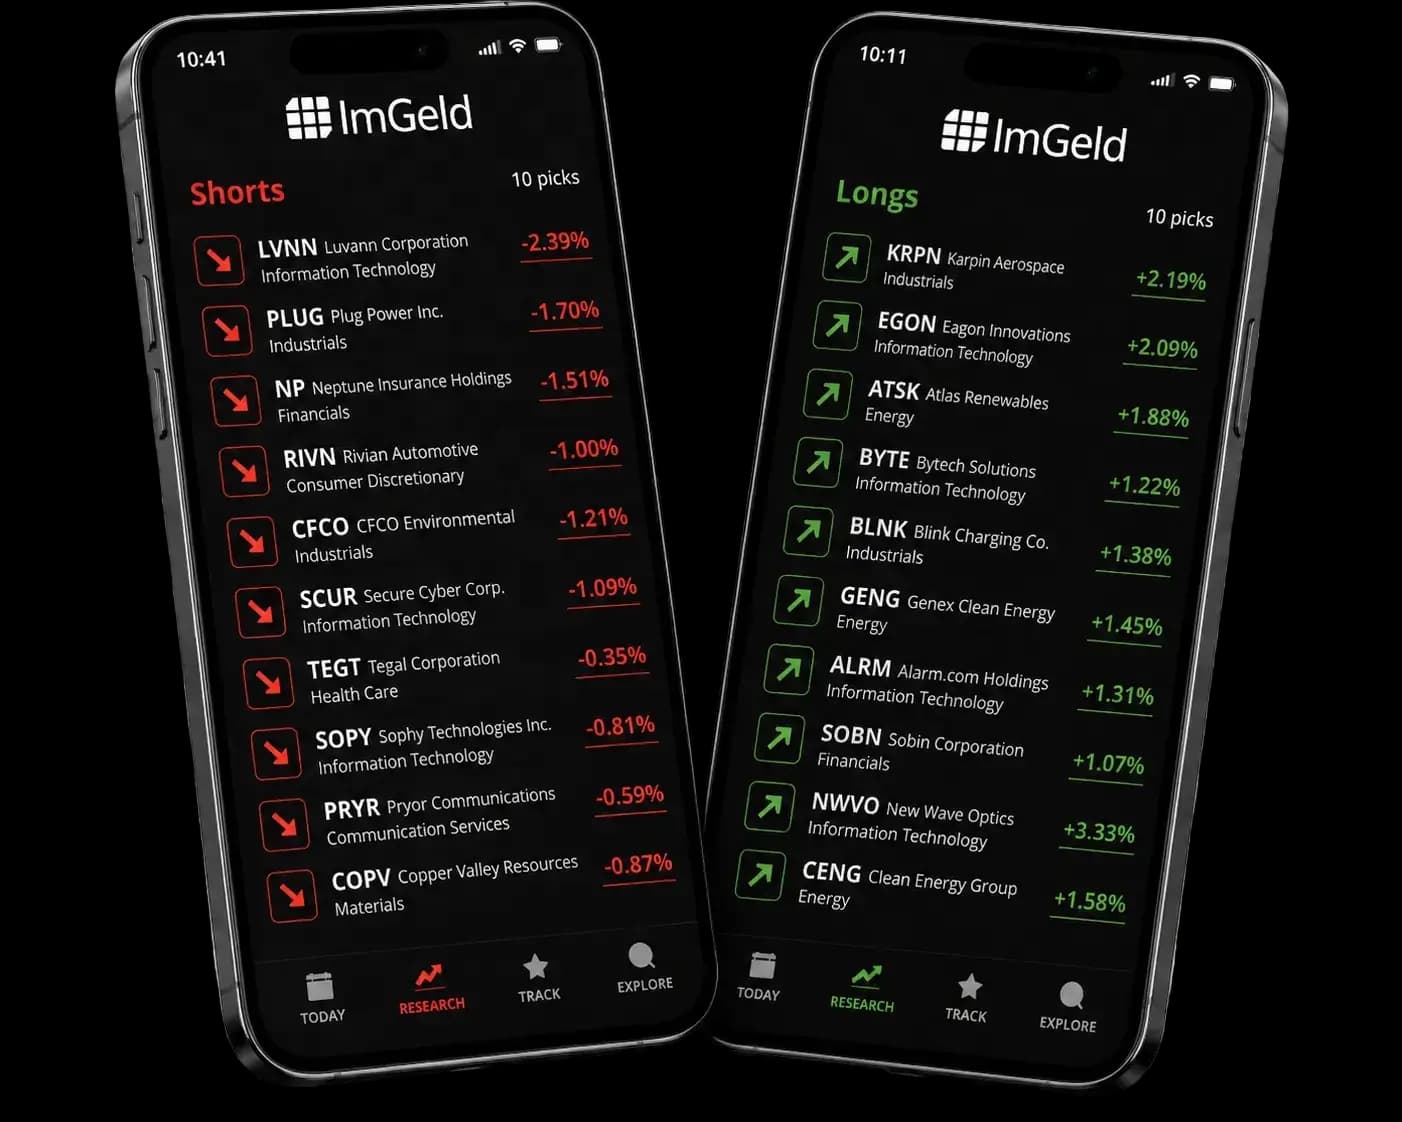
ImGeld gives equity traders a daily Long & Short framework built from industry strength, stock fundamentals, volatility and earnings risk, so every idea starts with a reason.
$35 / month · Cancel anytime.
Works with your broker


40
US industries ranked every trading day, the full Industry Heat Map universe.
20–30
Long & Short stock candidates worth reviewing each trading day.
2
Sides in every report: Long and Short candidates.
$5–15B / $25B+
Longs in the $5–15B range, shorts $25B+, matched for real diversification.
| Ticker | Industry | IMG Ind Sta1 | MC (Bil) | Case | D2ED2 | %vs200D3 | NATR144 |
|---|---|---|---|---|---|---|---|
| KRMN | Aerospace - Defense Equipment | Growing | 6.15 | Long | 43 | -40.1% | 9.3% |
| KTOS | Aerospace - Defense Equipment | Growing | 9.53 | Long | 43 | -36.4% | 7.5% |
| AG | Mining - Silver | Stable | 8.15 | Long | 50 | -9.1% | 7.7% |
| MXL | Computer - Micro Computers | Growing | 7.98 | Long | 28 | +182.7% | 10.9% |
| ENVA | Financial - Consumer Loans | Growing | 5.25 | Long | 27 | +45.0% | 3.1% |
| VSXY | Retail - Apparel and Shoes | Growing | 6.26 | Long | 63 | +62.1% | 5.6% |
| ALL | Insurance - Property and Casualty | Stable | 59.61 | Short | 42 | +12.4% | 2.3% |
| AGNC | REIT and Equity Trust | Contracting | 11.98 | Short | 26 | +3.9% | 1.7% |
| NVO | Large Cap Pharmaceuticals | Growing | 209.92 | Short | 42 | +1.3% | 3.2% |
| PFE | Large Cap Pharmaceuticals | Growing | 140.89 | Short | 41 | -2.0% | 2.0% |
| BMY | Medical - Biomedical and Genetics | Contracting | 113.40 | Short | 36 | +4.8% | 2.4% |
| KEP | Utility - Electric Power | Contracting | 15.42 | Short | 49 | -25.1% | 4.2% |
1. IMG Industry Status reflects the current state of each industry: Growing (expanding), Stable (steady), or Contracting (declining).
2. D2ED = Days to next Earnings release (number of days until the company's next scheduled earnings report).
3. %VS200D = Price position relative to the 200-day Moving Average (200 MDA); the percentage the current price is above (+) or below (−) the 200-day MA.
4. NATR14 = Normalized Average True Range (14 periods): the average daily price range over the last 14 periods, expressed as a % of price. E.g., 9.3% means the asset moves ~9.3% of its price on a typical day (higher = more volatile).
*Long & Short Signals snapshot · 2026-06-24.
From thousands of stocks to a focused Long & Short list. ImGeld screens US equities by industry strength, fundamentals, momentum, volatility and earnings risk, leaving you with 20–30 candidates worth reviewing for your portfolio.
Every candidate sits inside an industry that's expanding, stable, or contracting. That context comes attached — you never look it up.
Each name carries its side of the trade. You know whether you are evaluating a Long or a Short before you ever open a chart.
Volatility profile, days to earnings, and key technical levels, so you can size, time and decide consistently.
Industry Strength
18.7
Food Products
Consumer Staples
Industry Strength
94.4
Technology Storage & Peripherals
Technology
Industry Strength
86.1
Semiconductors & Semiconductor Equipment
Technology
Industry Strength · Growing / Stable / Contracting · updated daily
I didn't realize it for years: professionals read the industry before the stock, never the reverse. ImGeld is built the same way. Market first, industry second, stocks last.
Ethan Brooks
Self-directed investor
Daily delivery
Long & Short list in your inbox
Start free with the Industry Heat Map, or go straight to filtered Long & Short candidates with a 7-day trial.
Industry Heat Map
Free
See which US industries are expanding or contracting before opening a position, without paying for a full report.
40 industries · Daily Excel
Long & Short Signals
$35/mo
Long & Short stock candidates filtered by industry strength, fundamentals, and volatility, each trading day.
7-day free trial · Full Industry Heat Map included
Business fundamentals, market momentum, and one weighted score. Recalculated every trading day across 40 US industries.
Fundamental consensus across the companies that compose each industry: revenue, earnings, growth, margins.
*So you know whether the industry's business is expanding or contracting.

Price momentum signal of those same companies: technical strength, capital flow, relative performance.
*So you know where the market is already voting with capital.
A single weighted score combining both layers. Recalculated every trading day across 40 US industries.
0 to 100 · 40 US industries · Updated daily
Start free with the daily Industry Heat Map, or go straight to the filtered Long & Short candidates with a 7-day free trial.
Free Industry Heat Map · 7-day trial on Long & Short Signals · See pricing details
You get one email with 20–30 curated Long & Short candidates plus the full Industry Heat Map ranking of all 40 US industries, delivered daily to your inbox.
After seven days, your Long & Short Signals subscription continues at $35 per month unless you cancel.
Yes. Cancel from your account settings or by emailing traders@imgeld.com. There are no long-term contracts, and you will not be charged after cancellation.