
ImGeld Platform
What You Receive with ImGeld
ImGeld is a market structure and portfolio context system designed for disciplined equity traders. It does not generate signals or predictions. Instead, it provides the data, structure, and framing needed to make informed risk and allocation decisions.
All outputs are delivered on a consistent schedule and designed to integrate into professional trading workflows.
Daily Market Structure Coverage
Market Breadth Update (Mon–Fri)
Most traders enter positions without knowing the direction of the market.
This daily update tells you exactly that — are conditions favoring exposure, or is the market thinning out beneath the surface?
▪ NYSE advance–decline behavior
▪ Participation and internal momentum context
▪ Clear framing around risk-on, risk-off, or selective conditions
Use it before initiating new exposure or adjusting portfolio risk. Not to predict direction — to understand the environment you’re trading in.

Industry Leadership & Dispersion
Top 5 / Bottom 5 U.S. Industries (Wed & Sun)
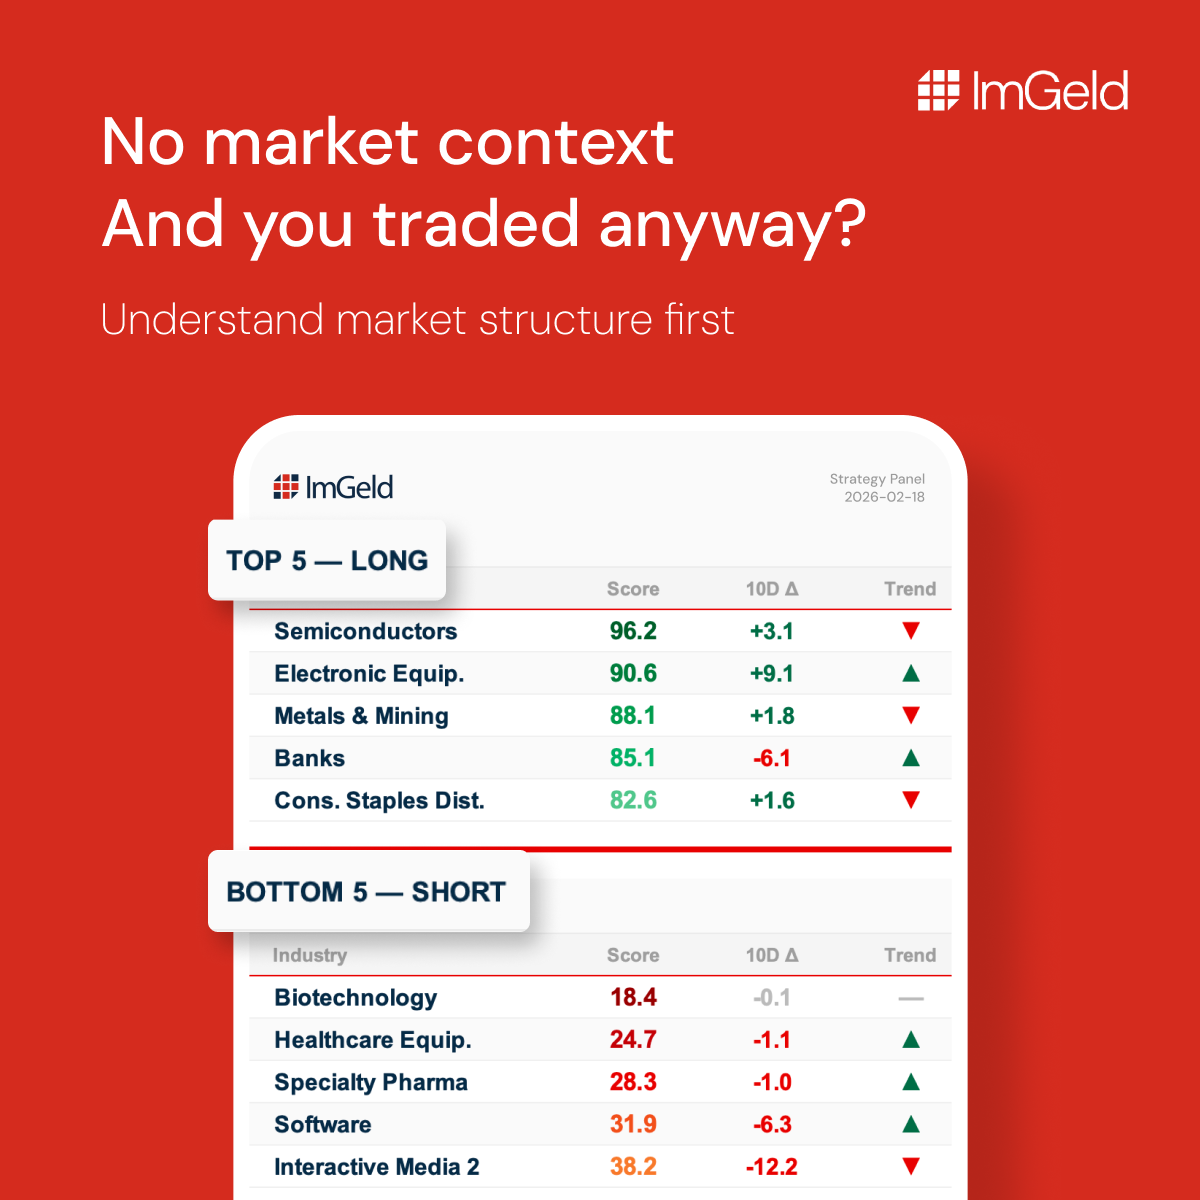
A concise view of relative industry strength and weakness across the U.S. equity market.
You receive:
▪ For each industry you understand why it’s moving — not just a score.
▪ The structural forces behind it: what’s driving investor demand and where capital is rotating.
▪ Which companies are at the center of that movement.
This is designed to support capital allocation and idea prioritization, not stock picking.
U.S. Industries Heat Map (Daily – Email Only)
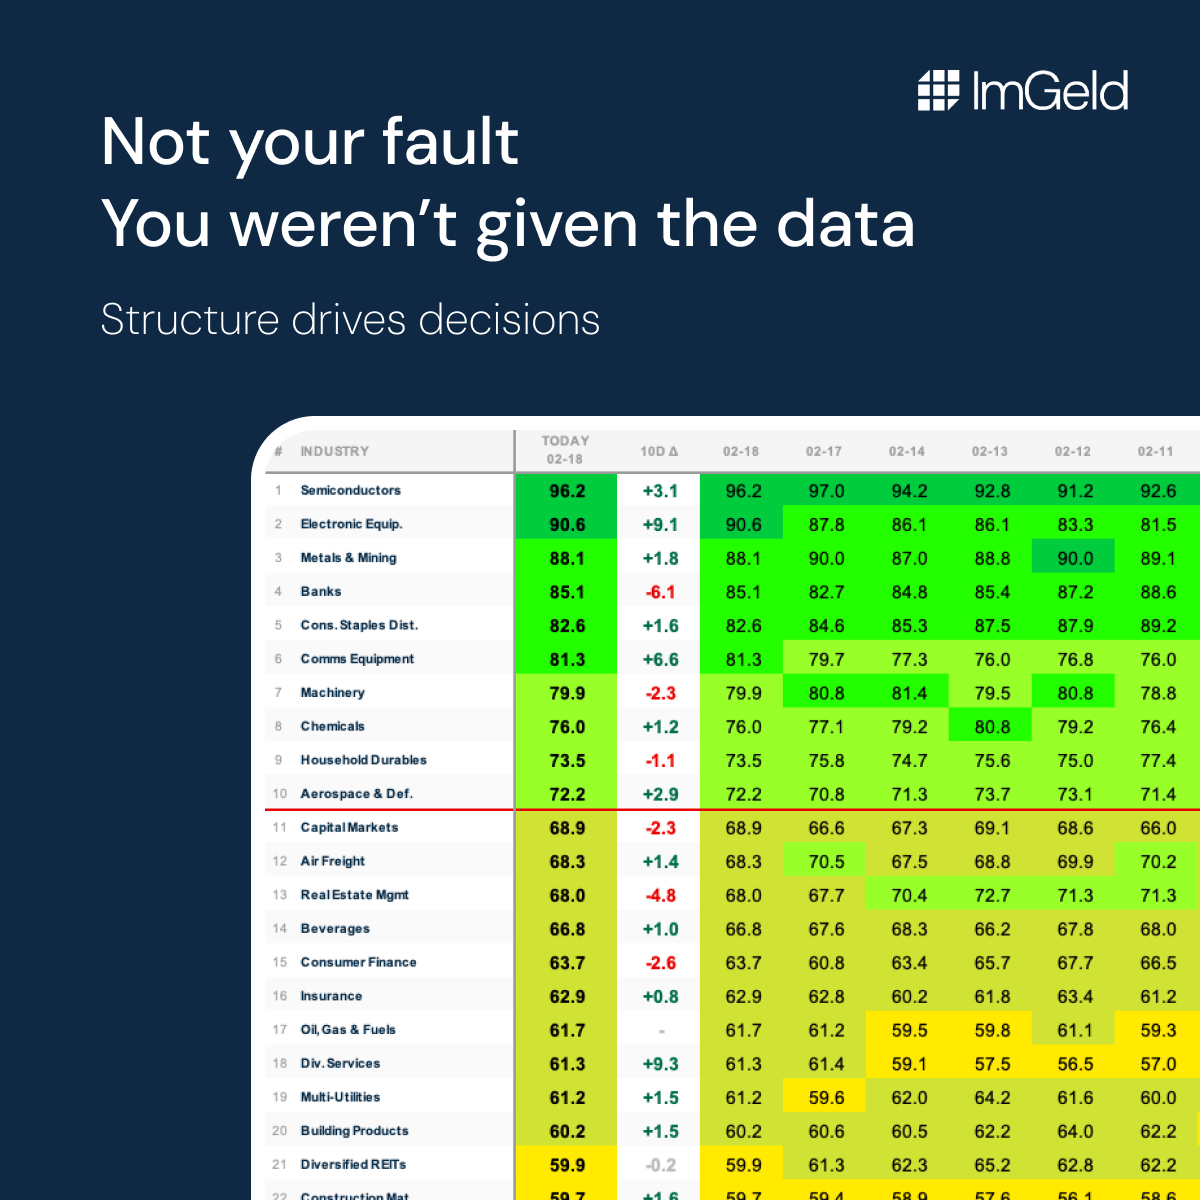
A daily Excel-based dataset providing full industry rankings and momentum context.
You receive:
▪ A complete ranked universe of U.S. industries
▪ Strength and weakness indicators with 10-day momentum evolution
▪ A format suitable for tracking, filtering, and independent analysis
This dataset is email-only and not published publicly.
Structured Stock Analysis
One Stock Report (Sun, Tue, Thu)
A structured review of a single stock, designed to act as a second-layer filter, not a trade instruction.
Each report includes:
Fundamental context
Key technical reference levels
A TradingView link for independent validation
These reports are intended to complement your own screening and idea generation process.
Portfolio Construction Framework
ImGeld is built around a curated universe designed to reflect professional long–short construction principles.
Long candidates: Mid-cap equities (approximately $3B–$10B market cap)
Short candidates: Large-cap equities (greater than $20B market cap)
This segmentation is designed to:
Improve dispersion
Reduce factor overlap
Support more controlled risk expression
Full Reports & Extended Coverage
Registered subscribers receive ongoing market and industry analysis.
Subscribers who upgrade to the ImGeld Fundamental Report gain access to:
The complete long–short stock universe
Embedded fundamentals and technical references
Expanded datasets supporting deeper portfolio work
This tier is designed for traders who want full transparency and breadth, not just highlights.
Analytical Standards
ImGeld follows a disciplined, evidence-driven analytical process focused on:
Market structure
Participation
Relative strength
Risk context
All analysis is neutral in tone and avoids narrative-driven conclusions. The objective is clarity, not conviction.
Who ImGeld Is For
ImGeld is built for:
Independent equity traders
Portfolio-oriented investors
Traders who prioritize drawdown control and process
Users who already work with charts, spreadsheets, and structured data
It is not designed for:
Signal seekers
Day trading alerts
Short-term prediction services
Beginner education
How Professionals Use ImGeld
Most subscribers use ImGeld to:
Assess daily risk conditions before deploying capital
Narrow focus to industries showing real leadership
Validate ideas within a broader market regime
Maintain discipline during uncertain or volatile periods