
US Industries Heat Map
Before you open any position, you need to know which industries are strong and which are falling apart.
Not after, before.
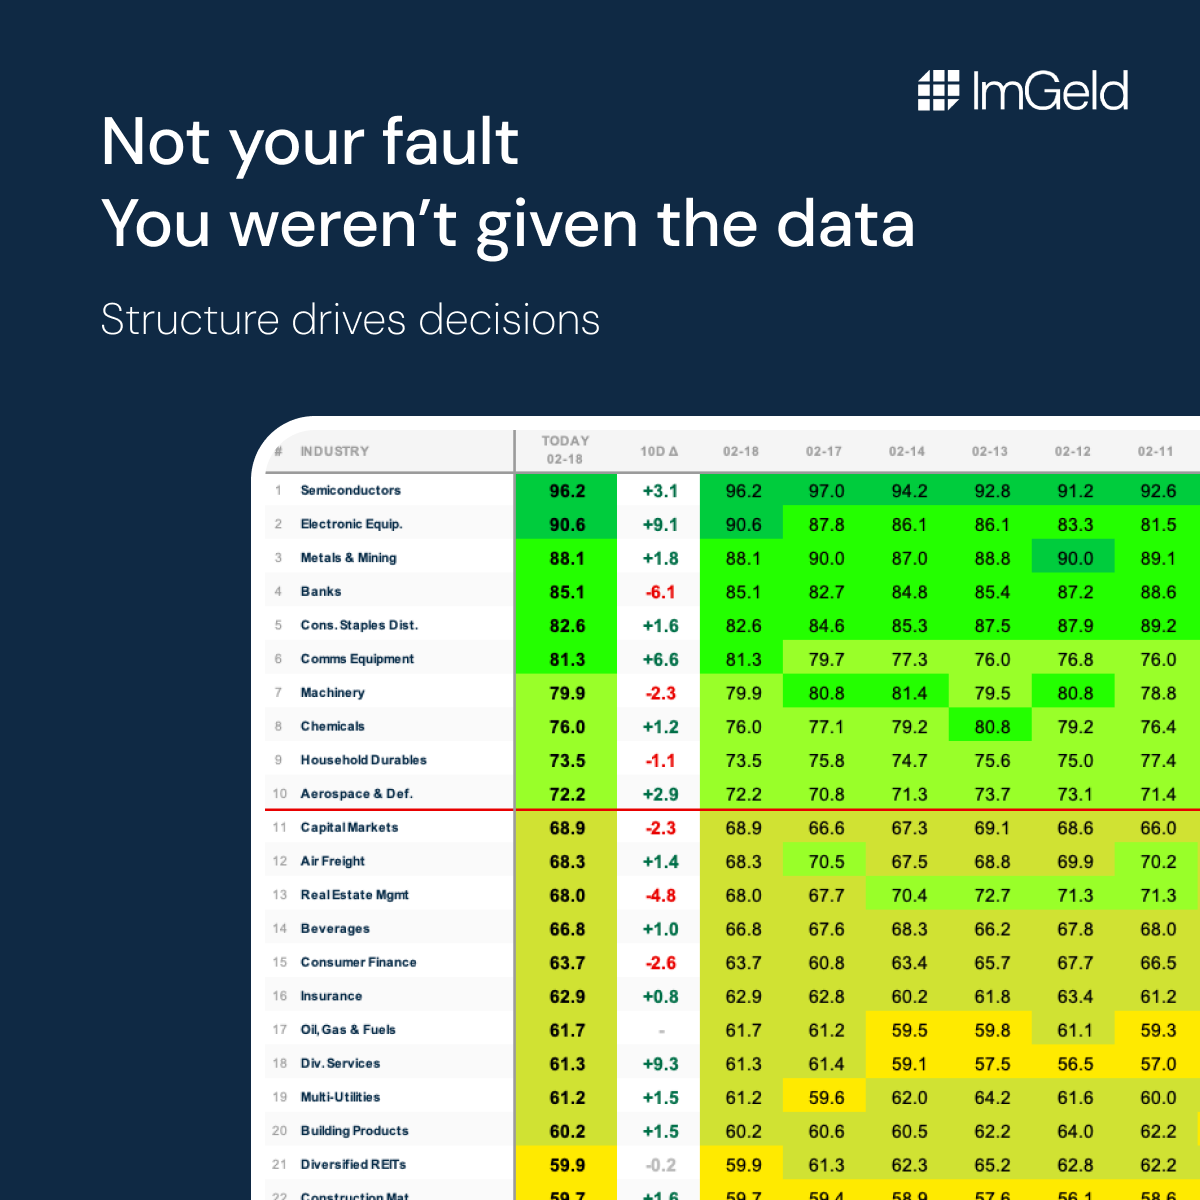
ImGeld tracks 40 US industries and ranks them by momentum every single day. The full ranking — delivered as an Excel file to your inbox before the market opens.
This is what you receive every trading day:
Get the full Heat Map in your inbox. Every trading day. Free.
No credit card. No payment. Just your email.
Most traders look at stocks. Professionals look at industries first. Because a stock doesn't move in isolation. It moves with its industry.
Going long on a stock whose entire industry is collapsing isn't a trade. It's a bet.
The full US industries ranking. Every trading day.
40 US industries ranked by momentum score
10-day trend for each industry — not just today's snapshot
Delivered as an Excel file directly to your inbox
Available before the market opens
This is what most people see for free on ImGeld : Top / Bottom 5
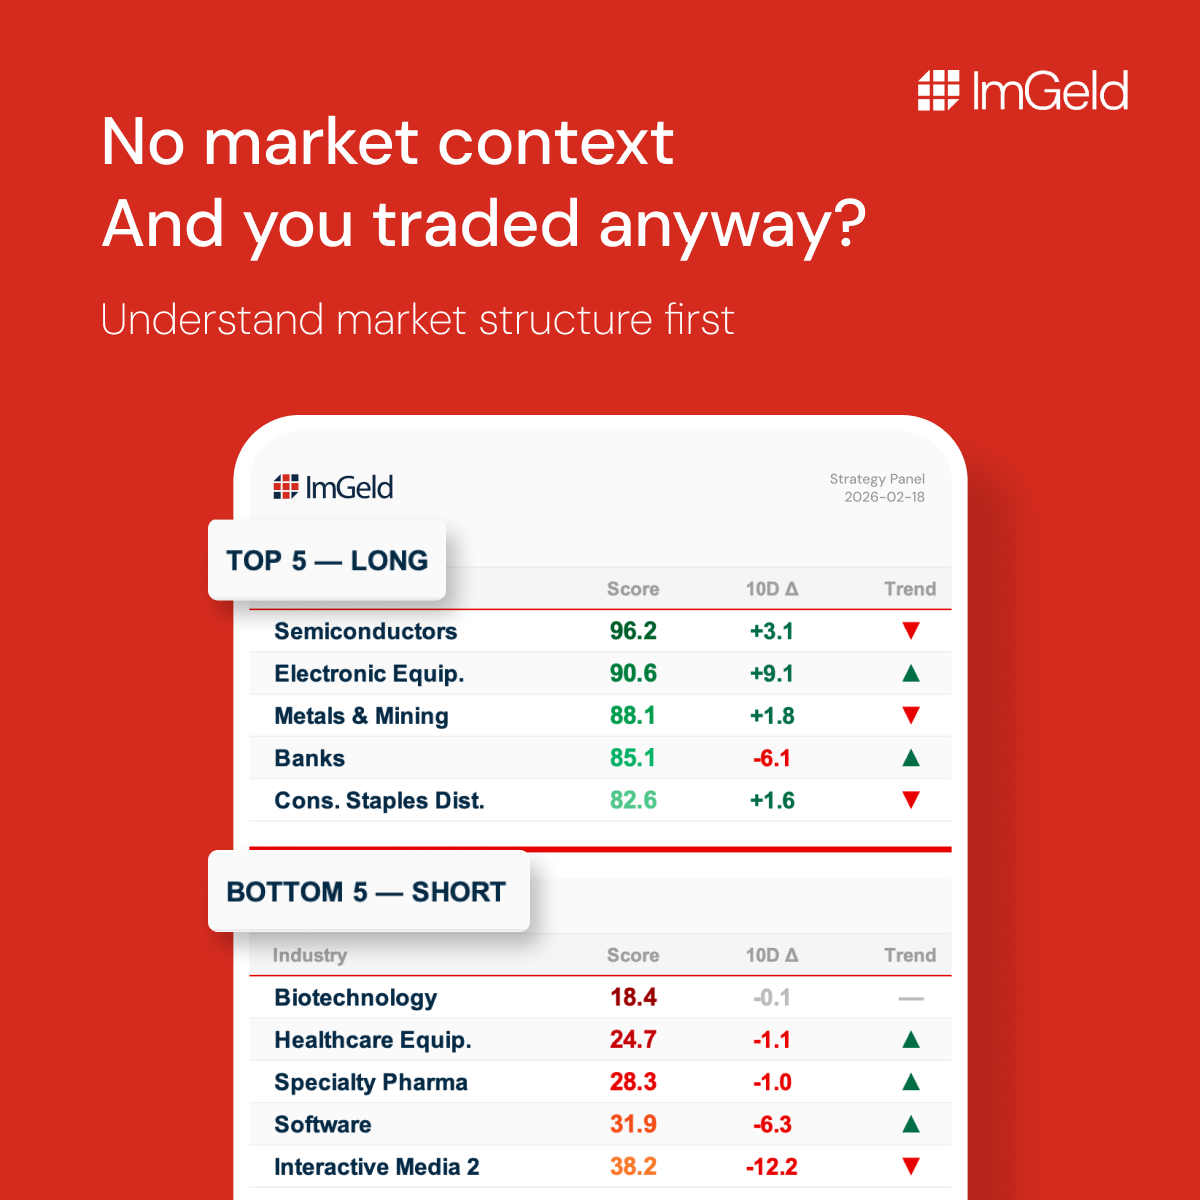
The Heat Map gives you all 40.
How the ranking works
Each industry gets a momentum score built from two layers: the fundamental data of the companies that compose it, and their price momentum — updated every trading day. An industry climbing from 35th to 15th tells you more than one sitting at number one.
No noise. No opinions. No predictions. A structured dataset you can actually use.
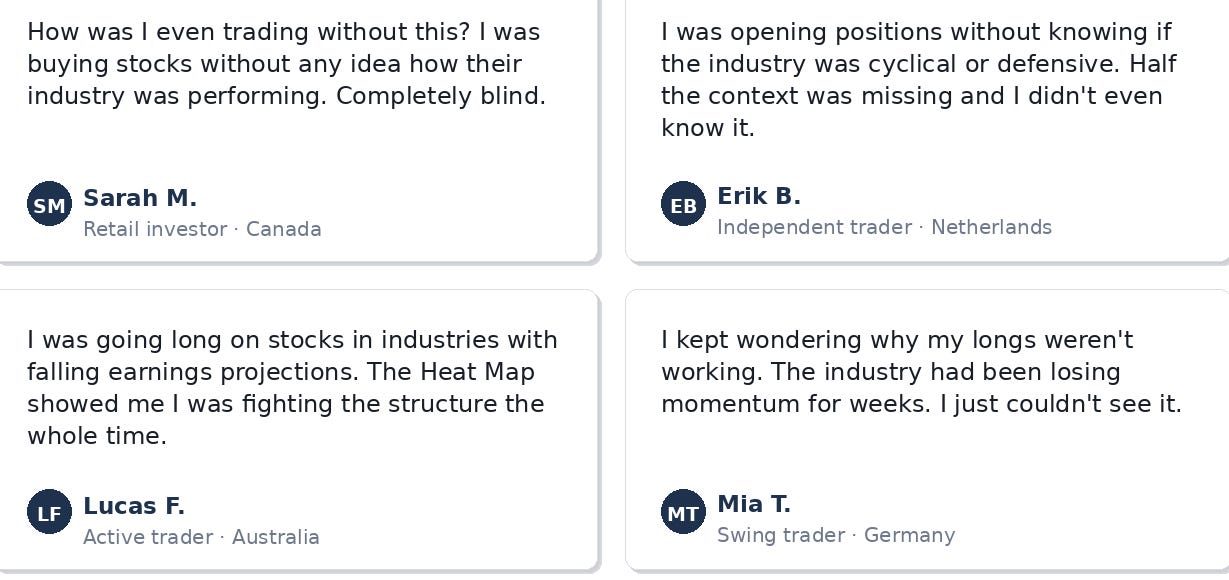
What traders say
Free. Every trading day. No credit card
Want the stocks that move with those industries?
The Portfolio Builder takes the Heat Map one step further. Every morning, before the market opens, you get a curated list of Long and Short stock candidates — each one already filtered by industry momentum, fundamentals, and technicals. You know which industries are leading. Now you know which stocks inside them are worth watching.