
The McClellan Oscillator at -249: What This Breadth Signal Is Telling Disciplined Traders.
The McClellan Oscillator is at -249. Here is what the signal requires before it confirms a rebound.Understanding what this breadth signal says — and what it requires before it confirms a rebound.

A Number Worth Watching More Closely Than Oil Headlines
While financial media fixates on crude prices and geopolitical statements, a quieter signal in market structure is flashing at levels not seen since the most acute phase of the 2025 tariff crisis.
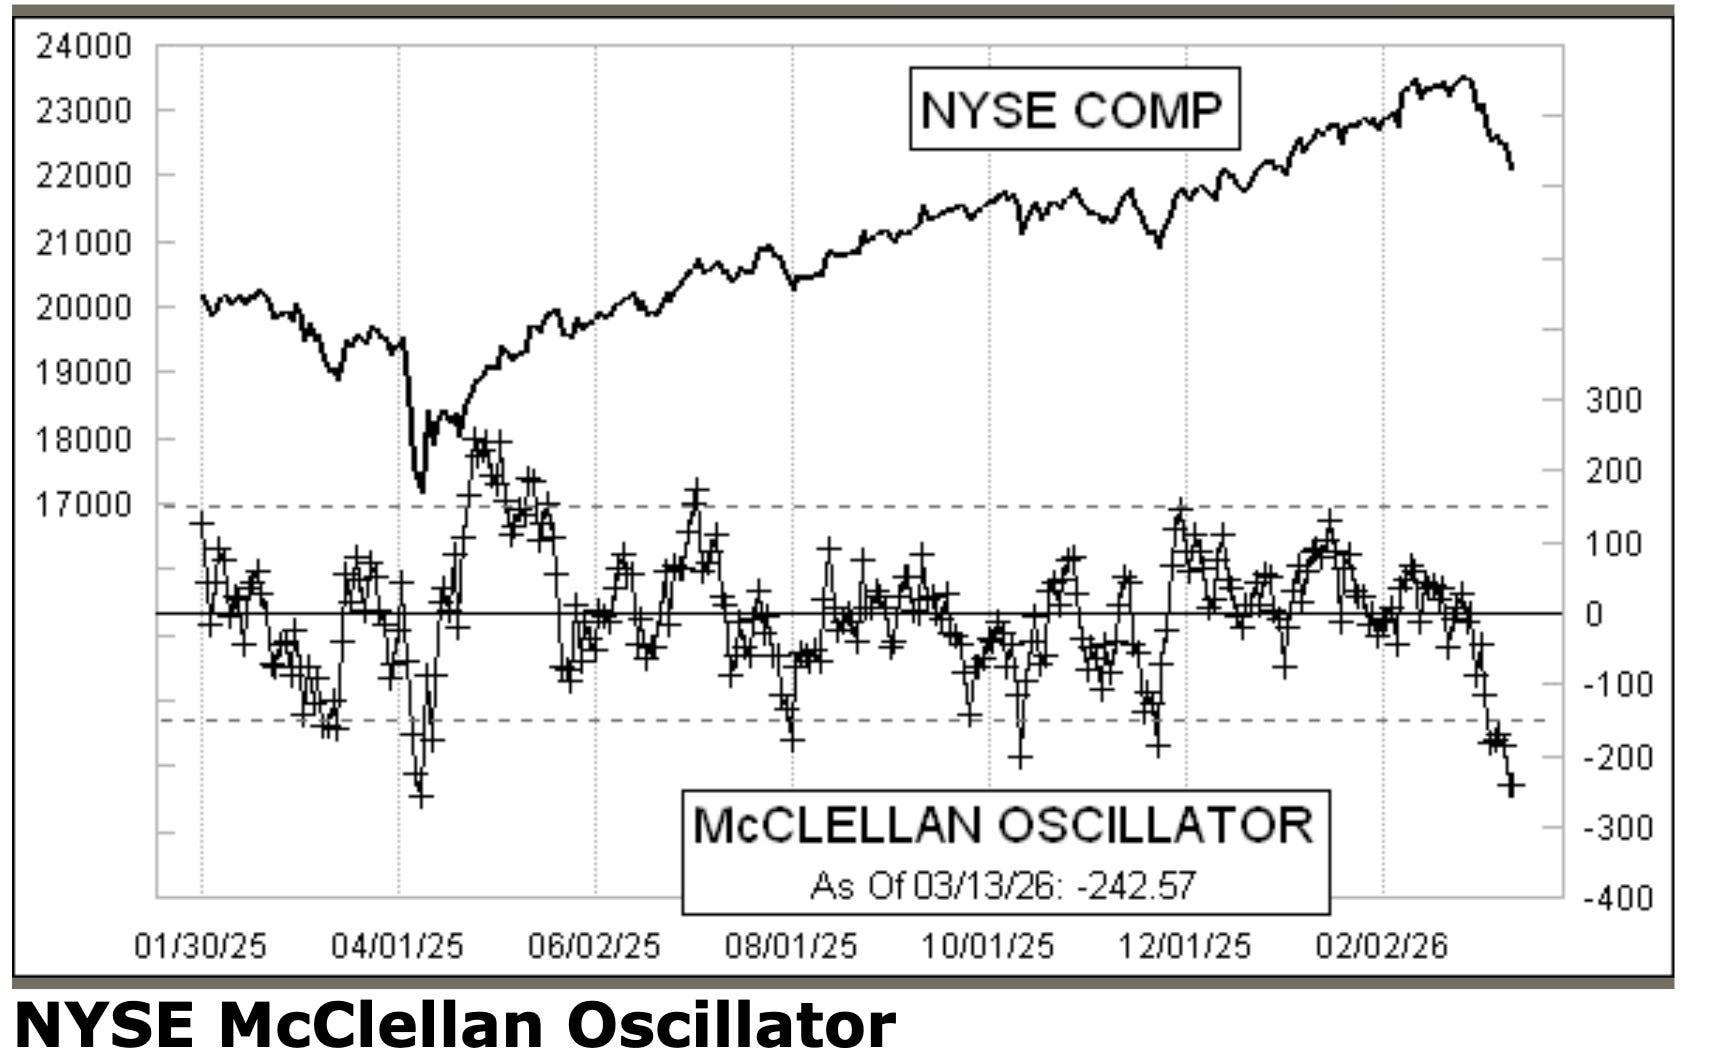
The McClellan Oscillator is currently at -249.
This is not a trade signal. Not yet. But it is the kind of reading that historically precedes some of the sharpest and fastest rebounds in US equity markets — and understanding its mechanics, its current context, and precisely what it requires to generate an actionable signal is what separates reactive traders from those who are positioned before the crowd recognises the opportunity.
What the McClellan Oscillator Actually Measures
The McClellan Oscillator is a breadth indicator calculated from daily advance–decline data on the NYSE — a market with nearly 3,000 listed securities. It measures the difference between a short-term and a longer-term exponential moving average of net advancing issues.
The result is a momentum indicator for market participation, not price. It answers the question that index levels cannot: are the majority of stocks moving with the market, or is the surface calm masking internal deterioration?
This is precisely why ImGeld tracks NYSE internals — the advance–decline line, new highs and lows, and the summation index — as a macro overlay alongside its industry rankings. These breadth metrics provide the structural context that price action alone cannot reveal. A sector may show strong fundamentals while the broader market deteriorates internally. The McClellan Oscillator is one of the clearest expressions of that internal condition.
When the oscillator reads deeply negative — as it does now — it means advancing stocks have been consistently and significantly outnumbered by declining stocks over a sustained period. The breadth of selling is broad. It is not concentrated in one sector or one cohort. It is systemic.
That condition is uncomfortable to hold through. It is also, historically, the condition that precedes recoveries.
The Signal Mechanics: One Rule, Clearly Defined
The McClellan Oscillator’s rebound signal is precise and has a consistent historical record. It requires two conditions to be met in sequence:
First, the oscillator must fall below -100 — indicating that selling breadth has reached a threshold of genuine stress. This condition is already met. The oscillator is well below -100.
Second, the oscillator must cross back above -100 clearly and with conviction from below. That crossover — not the low reading itself — is the signal. The low tells you stress is present. The crossover tells you the stress is resolving.
This distinction is important. Acting on the deeply negative reading alone — buying because the oscillator is at -249 and “must bounce” — is not the signal. It is anticipation of the signal, which is a different and considerably riskier proposition.
What the Last Comparable Reading Showed
The most recent occasion on which the McClellan Oscillator reached comparable levels was during the acute phase of the 2025 tariff crisis — when markets sold off sharply in response to aggressive US trade policy announcements.
At that time, the oscillator dropped deep into negative territory. Traders who waited for the confirmed crossover above -100 missed the very first leg of the recovery — but captured the substantial move that followed. The signal was not perfect timing. It was reliable timing: late enough to confirm that the selling exhaustion was genuine, early enough to participate in the majority of the rebound.
That pattern is consistent with the oscillator’s historical behaviour across multiple market dislocations. It does not call the exact bottom. It identifies the point at which breadth confirms that the bottom is forming — which is a structurally more reliable entry than guessing the intraday low.
Current Context: Why This Reading Matters Now
The oscillator reaching -249 in the current environment carries additional weight because of what is driving the breadth deterioration.
The selling is not concentrated. It reflects a simultaneous repricing of risk across sectors — oil-sensitive names, credit-exposed financials, growth-oriented technology, and cyclical industrials are all contributing to the negative advance–decline data that feeds the oscillator. When multiple, structurally unrelated sectors sell simultaneously, the oscillator’s negative reading is more meaningful than when a single sector drives the number.
It also means the recovery signal — when it arrives — is likely to be equally broad. Rebounds that follow wide selling tend to lift participation across sectors rather than concentrating gains in the names that led the decline.
The ImGeld Industry Rating provides the sector-level context for that recovery. The same framework that tracks NYSE advance–decline data and new highs vs new lows as a macro overlay also ranks industries by fundamental momentum. When the McClellan Oscillator confirms a rebound, the industries with the strongest underlying scores — those at the top of the ranking — historically lead the move. Industries that were deteriorating before the sell-off tend to recover less and give back gains faster.
The oscillator tells you when the structural condition for a rebound is in place. The industry ranking tells you where to deploy when it is.
What Disciplined Traders Do With This Information
The McClellan Oscillator at -249 is not an invitation to buy. It is an instruction to watch closely.
The framework ImGeld is built around exactly this kind of sequencing: identify the structural signal, define the precise condition required for it to confirm, and wait. Not because patience is a virtue in the abstract, but because acting before confirmation has a documented cost — being early in a deteriorating breadth environment is indistinguishable from being wrong.
The sell signal generated by this oscillator several weeks ago was clear. The market has not stopped declining since. Those who acted on it avoided significant drawdown. The buy signal will be equally clear when it arrives — a definitive crossover back above -100, not a tentative approach.
Until then, the appropriate response is reduced gross exposure, maintained conviction in the strongest fundamental positions, and daily attention to the one number that will tell you when the environment has genuinely changed.
Process over prediction. Structure over narrative. Risk before conviction.
References
McClellan Financial Publications — McClellan Oscillator Data and Market Breadth:
https://www.mcoscillator.com