
The McClellan Oscillator at -137: What Extreme Breadth Deterioration Tells Disciplined Traders
The McClellan Oscillator has reached -137 on the NYSE. Extreme breadth deterioration of this kind has historically preceded significant recoveries — but only once confirmed. Process matters more than

Two Numbers. One System.
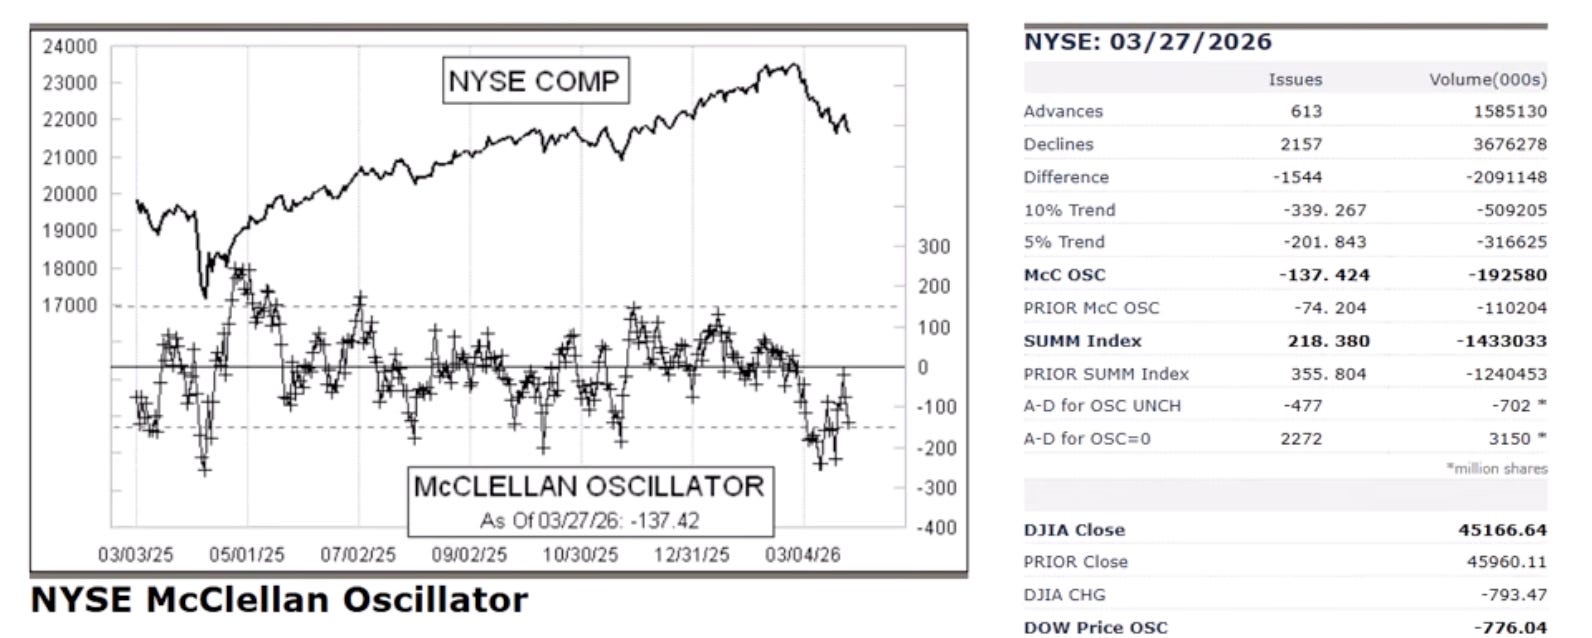
On 27 March 2026, the NYSE recorded 613 advancing issues against 2,157 declining. The DJIA closed down 793 points. The McClellan Oscillator printed at -137.42.
Most traders who follow breadth analysis know the McClellan Oscillator. Fewer understand its relationship to the NYSI — the NYSE McClellan Summation Index. The two indicators are not alternatives. They are the same system operating on different time horizons. Understanding that relationship is what makes the current reading structurally significant.
Velocity vs. Position: The Core Distinction
The cleanest way to understand the two indicators is through a simple analogy.
The McClellan Oscillator is velocity. It measures how fast breadth momentum is accelerating or decelerating on any given day. It is calculated as the difference between the 19-day EMA and the 39-day EMA of daily net advances — the same MACD logic applied to breadth rather than price. When it reads -137, it means short-term breadth momentum has deteriorated sharply relative to the intermediate trend.
The NYSI is position. It is the running cumulative total of every daily McClellan Oscillator reading. In other words:
NYSI (today) = NYSI (yesterday) + McClellan Oscillator (today)
This single equation explains everything about how the two indicators relate. One is the daily input; the other is the accumulated output.
With the NYSI entering the current session at -198.67 and the McClellan Oscillator printing at -137.42, the estimated NYSI as of 27 March stands at approximately -336 — a level that places intermediate breadth in deeply negative territory.
What Each Level Tells You
The McClellan Oscillator’s -137 reading indicates that selling pressure is dominant and accelerating. Readings below -100 are widely regarded as oversold territory — a structural condition where breadth has deteriorated to a degree that historically precedes at least a mean-reversion bounce, and at times a more durable recovery.
The NYSI at -336 tells a different story. Because it is cumulative, it reflects the sustained weight of deteriorating breadth over multiple sessions, not just yesterday’s data. It indicates that intermediate-term market participation has been weakening consistently — not just sharply. When the NYSI falls this deep into negative territory, it suggests the deterioration is structural, not episodic.
The combination of both — a deeply negative oscillator and an accelerating negative NYSI — is the condition that experienced breadth analysts treat as the most meaningful oversold regime.
The Historical Signal: Recovery from Extreme Depth
The question that matters for traders is not whether the current readings are extreme. They clearly are. The question is what has historically followed.
The answer depends on confirmation. A deeply oversold McClellan Oscillator does not become a buy signal by virtue of being deeply negative. The signal activates when the oscillator recovers — specifically when it produces two consecutive daily closes clearly above the -100 level after reaching extreme oversold depth. That recovery reflects genuine exhaustion of selling pressure rather than a temporary pause within a continuing decline.
Historical analysis of breadth thrust patterns — where the oscillator surges from deeply negative to strongly positive territory — shows this has occurred only 21 times since 1940, with 20 of those instances followed by significant market gains. The March 2009 bottom, the March 2020 crash low, and the October 2022 bear market low all produced this structure.
The NYSI provides the complementary confirmation. When the Summation Index begins to turn higher from deeply negative levels — even while still negative — it signals that the daily velocity of breadth deterioration is slowing. That inflection in the NYSI, combined with sustained McClellan Oscillator recovery above -100, is the two-indicator confirmation that disciplined traders wait for before adjusting exposure.
As of this writing, neither confirmation has arrived. The McClellan Oscillator produced one session above the critical zone before retreating. The NYSI is still falling — now approaching -336. The market is at the edge of a potential inflection, not through it.
Portfolio Implications: What the Regime Requires
For traders managing long and short exposure, this combination of indicators is a regime signal, not an entry trigger. The current regime — deeply negative oscillator, accelerating negative NYSI — is one of broadly distributed selling pressure with no confirmed breadth recovery.
The appropriate response is exposure calibration: reduced concentration in long positions, attention to which industries are maintaining relative strength within a deteriorating aggregate, and defined criteria for when the evidence supports increasing exposure.
Industry-level analysis is particularly relevant at this juncture. The aggregate NYSI and McClellan Oscillator reflect market-wide breadth. But within that aggregate, specific industries may be contracting, stable, or — critically — showing improving momentum relative to the index. The All US Industries Momentum Heat Map ranks all 40 US industries daily, providing the granularity that index-level breadth readings cannot.
How ImGeld Covers This System
ImGeld tracks the NYSI as the core intermediate breadth indicator in the daily Market Breadth report. The most recent five-session update shows the NYSI declining from -119.26 to -198.67 with no evidence of reversal — confirming that positive daily breadth sessions are not converting into lasting accumulation.
The McClellan Oscillator provides the daily velocity reading that feeds directly into that NYSI trajectory. When the oscillator produces two consecutive sessions clearly above -100, that will be the first evidence that the NYSI’s rate of deterioration is genuinely slowing — and the first condition for a potential regime change.
Both indicators are tracked daily. The confirmation criteria are clear. What remains is patience and process.
Behavioural Risks at This Juncture
Premature conviction is the primary risk. Extreme oscillator readings can persist for extended periods during structural bear markets — as seen in 2008, when the indicator remained deeply oversold across multiple months. Acting on depth alone, without confirmation, compounds exposure into a continuing decline.
Narrative-driven selling is the inverse error. When the CNN Fear & Greed Index prints at 10 and breadth data looks as compressed as it does now, the pull toward capitulating into the prevailing narrative is powerful. The historical record suggests these are precisely the moments when process-based discipline produces the most durable outcomes.
Conflating the two indicators is a subtler mistake. Using the McClellan Oscillator as if it were the NYSI — or treating a single-session oscillator recovery as a Summation Index inflection — produces false signals. Each indicator answers a different question. Velocity tells you what is happening today. Position tells you what has been accumulating over weeks.
Process Over Panic
The McClellan Oscillator at -137 and the NYSI approaching -336 are not predictions. They are data points within a structured analytical framework. History suggests that readings at this depth, followed by confirmed breadth recovery across both indicators, have preceded significant market recoveries with notable consistency.
But the confirmation requirement exists for a reason. One session of improving velocity is not enough. A genuine inflection in cumulative position takes sustained daily evidence — not a single reading.
Structure over narrative. Process over panic. Risk awareness over conviction.
References
▪ McClellan Financial Publications — The McClellan Oscillator & Summation Index
▪ StockCharts ChartSchool — McClellan Oscillator
▪ StockCharts ChartSchool — McClellan Summation Index
▪ AAII Journal — Looking Beyond Price Trends With the McClellan Oscillator