
Pfizer at Resistance: When Price and Fundamentals Tell Different Stories
Pfizer trades near its 52-week high against a confirmed earnings contraction cycle. Pharmaceuticals industry momentum is deteriorating.

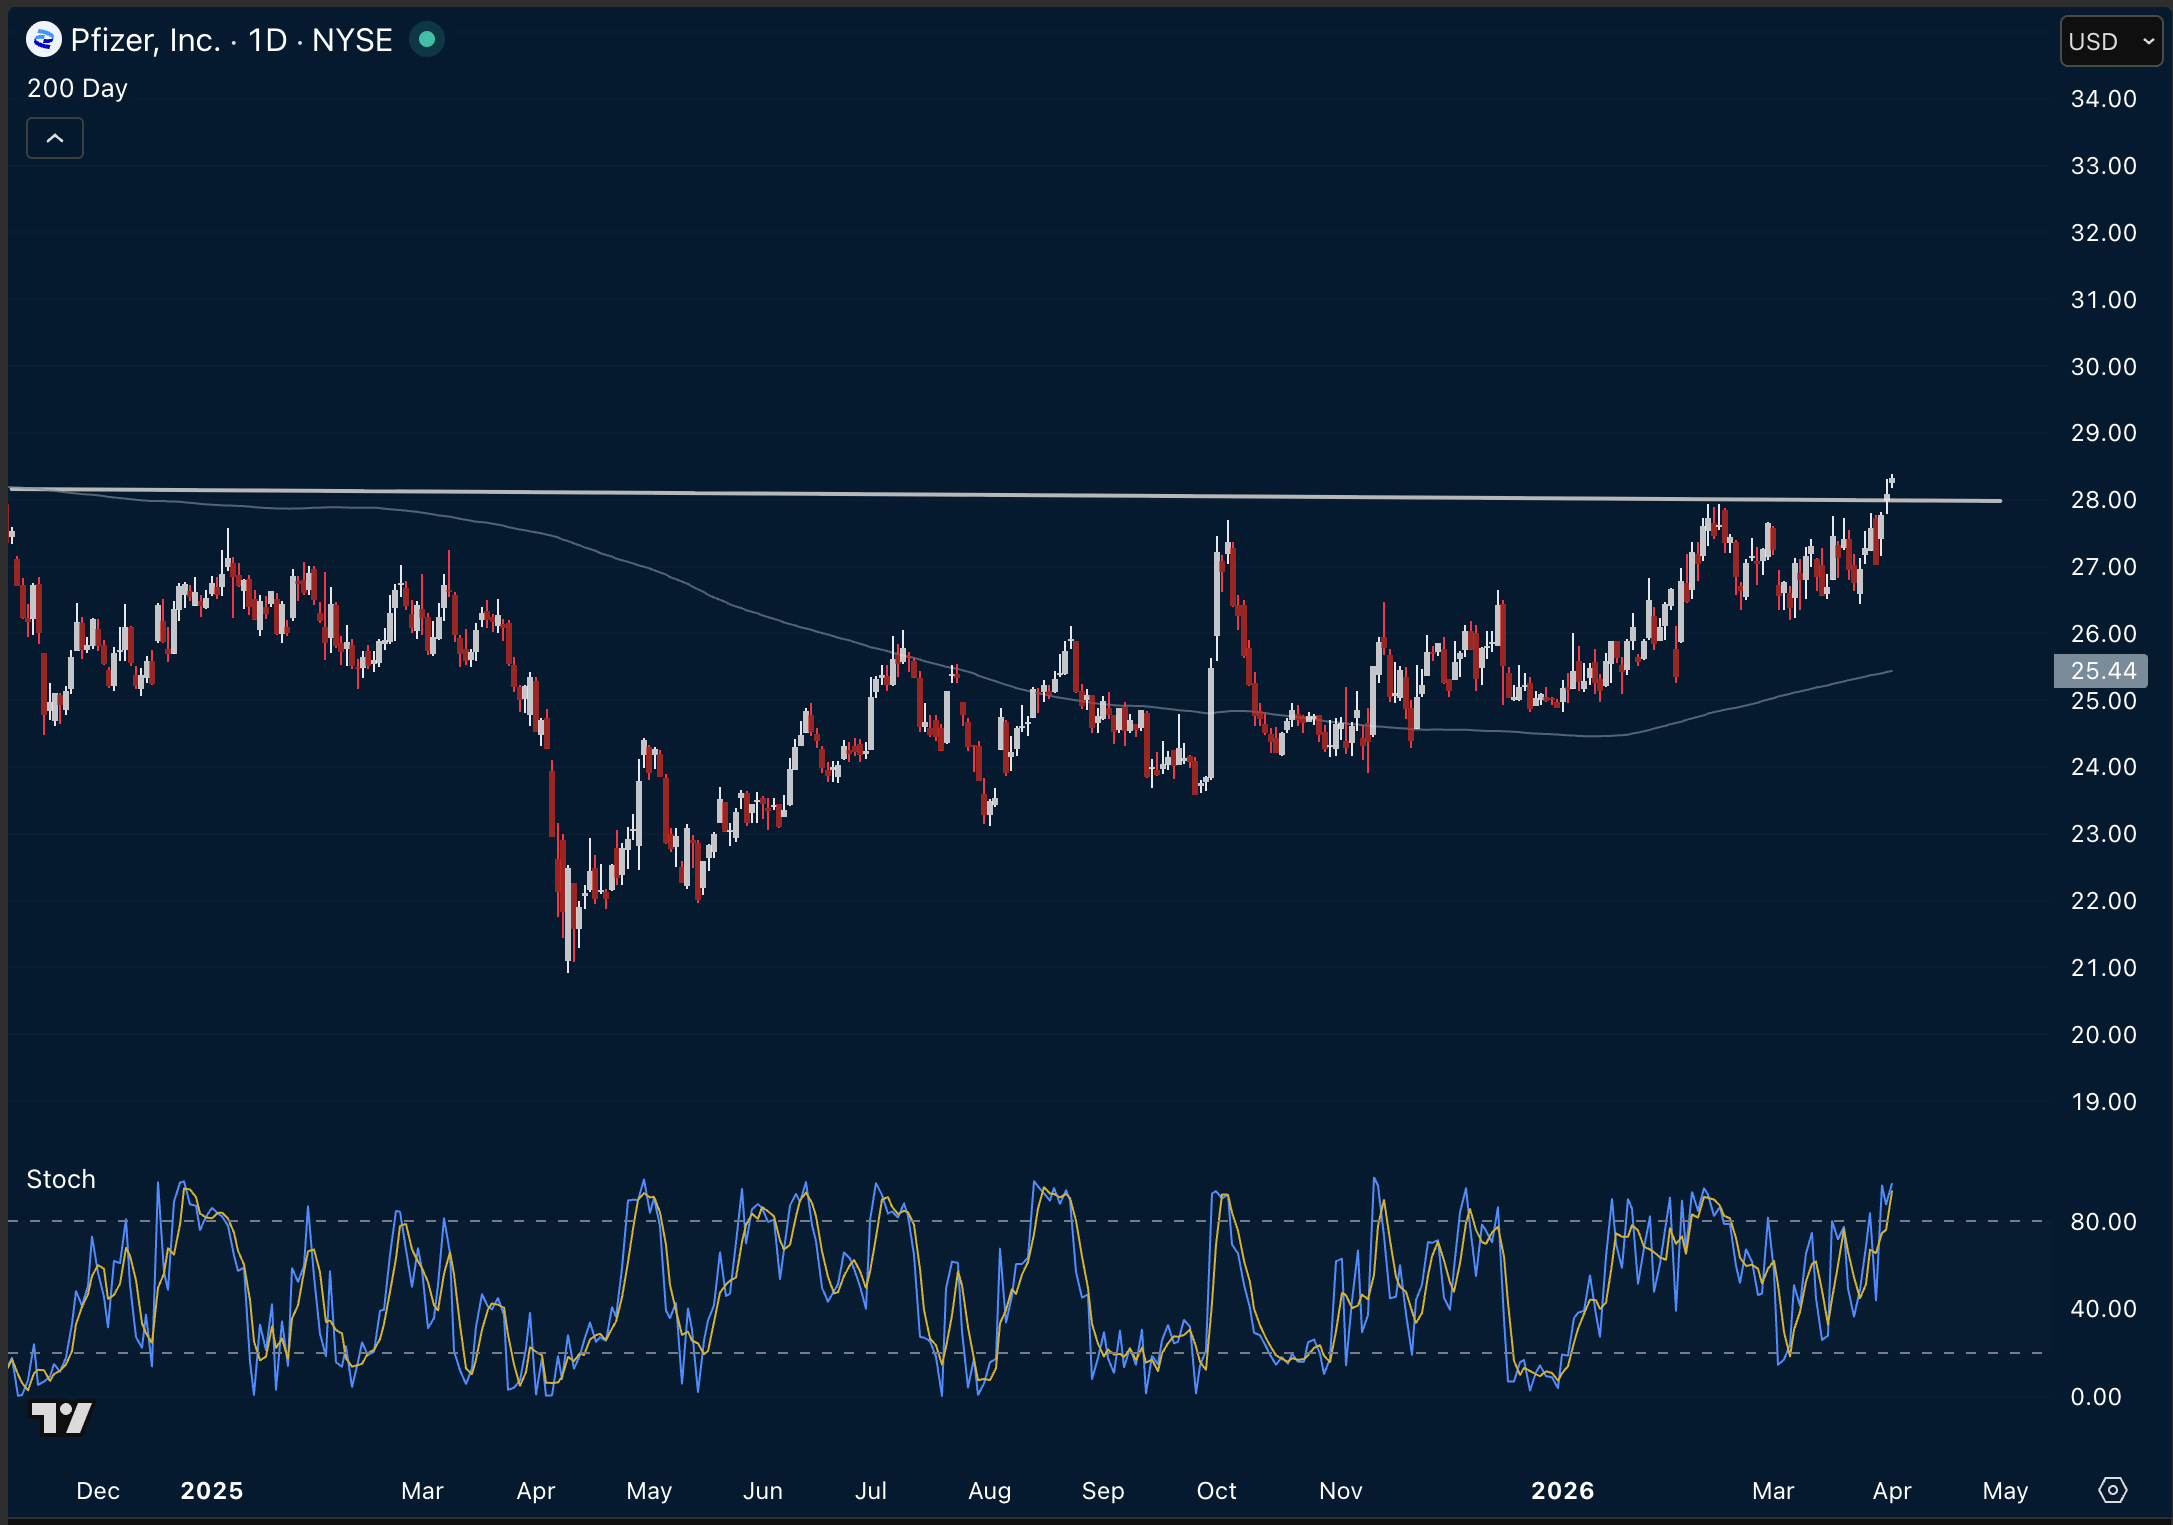
Pfizer has spent four months testing the same ceiling. The $27.50–$28.00 zone has rejected the stock on four separate occasions since November 2025. Each time, the configuration looked similar: price approaching resistance, Stochastic re-entering overbought territory, and the same fundamental backdrop of declining earnings guidance and structural revenue pressure.
As of March 31, 2026, the setup is repeating. What makes it worth examining now is not just the technical pattern — it is the combination of a deteriorating industry momentum rating, a confirmed multi-year earnings contraction cycle, and a market that has not yet positioned for the downside.
This is the kind of divergence that the ImGeld framework is built to surface.
The Industry Context
The Large Cap Pharmaceuticals industry currently carries a ▼ Contracting rating in the ImGeld Industry Momentum Map. This is not a neutral or transitional reading — it reflects sustained deterioration in sector-level earnings momentum driven by three structural forces that are well-documented and unlikely to reverse quickly.
Post-pandemic revenue normalisation has removed billions in high-margin COVID product revenues across the sector. For Pfizer specifically, management disclosed approximately $1.5B in COVID product revenue decline expected in 2026 alone — structural, not cyclical.
Loss-of-exclusivity pressure is accelerating. A major wave of patent expiries on blockbuster franchises between 2025 and 2030 is creating a revenue cliff that pipeline investment has not yet offset. Pfizer guided for an additional $1.5B headwind from loss-of-exclusivity impacts in 2026 — totalling $3B in identifiable, irreversible revenue pressure for the year.
IRA drug pricing reform continues to compress long-term pricing power across the sector, disproportionately affecting large-cap names with the broadest exposure to Medicare negotiation.
When an industry carries a Contracting rating, the burden of proof for long positions in that industry is significantly higher. The structural tailwind that normally supports equities — growing revenues, expanding margins, earnings upgrades — is absent or moving in the wrong direction.
What the Financials Show
The Q4 2025 earnings report, released February 3, 2026, confirmed the trajectory.
Full-year 2025 adjusted EPS came in at $3.22 — marginally above 2024’s $3.11. But the 2026 guidance range of $2.80–$3.00 represents a 7–13% step-down from 2025 actuals. This is a management-confirmed, multi-year EPS contraction cycle, not a one-off miss.
The Q4 operating margin turned negative at −9.3%, driven by acquisition-related charges and restructuring costs associated with Pfizer’s ongoing $5.7B cost-reduction programme. Non-COVID revenues grew 9% operationally in Q4, demonstrating that the base portfolio retains some resilience — but this growth is insufficient to offset the scale of COVID normalisation and patent expiries in aggregate.
The valuation picture adds another layer. Against Large Cap Pharmaceuticals industry averages, PFE trades at 9.10x current earnings versus an industry average of 16.08x — a 43% apparent discount. However, the earnings growth differential explains the gap entirely: PFE’s current earnings growth of −7.8% compares to an industry average of +5.5%, a 13.3 percentage point shortfall. The stock is not cheap — it is priced to reflect declining earnings in a sector where most peers are growing.
The Technical Structure
The chart tells a consistent story. Since November 2025, the $27.50–$28.00 zone has acted as a hard ceiling. The 200-day moving average sits at $25.40 — approximately 7.9% below the current price. Despite the confirmed earnings contraction, PFE is trading 11.9% above that long-term average.
The Stochastic indicator re-entering overbought territory above 80 precisely at resistance on March 31 replicates the exact configuration that preceded each prior rejection. This is not a novel setup — it is a pattern that has repeated four times within a defined range.
Short interest at 2.31% and Days to Cover of 2.91 indicate the market has not yet positioned for the downside thesis. The fundamental deterioration is confirmed; the positioning has not caught up.
Risk Factors Worth Monitoring
A framework built on process requires honest acknowledgement of the risks. Three factors merit specific attention within the trading window.
Pfizer has guided for approximately 20 pivotal trial starts in 2026. A positive Phase 3 readout for atirmociclib in oncology, the Lyme disease vaccine, or the GLP-1 obesity candidates from the $10B Metsera acquisition could drive sharp positive re-ratings. The obesity pipeline in particular represents a sentiment-transforming catalyst if Phase 3 data proves compelling.
The Q1 2026 earnings report is scheduled for May 5, 2026 — 36 days from the report date. Q4 2025 demonstrated a 14–18% beat above consensus. Another beat against already-reduced 2026 guidance expectations could reverse the short momentum and force covering. Any position must be managed with this date as a hard exit gate.
Dividend carry cost is a mechanical factor: Pfizer pays $0.43 per share per quarter. On a short position, this is an ongoing cost that erodes the trade if it takes longer than expected to materialise.
The Framework View
ImGeld’s top-down process evaluates stocks within their industry context before assessing individual merit. The sequence matters: industry momentum first, then stock-level structure and fundamentals.
In this case, the industry is rated Contracting. The stock is at the top of its range against a confirmed earnings downgrade cycle. The technical pattern of repeated resistance rejection is well-established. The market has not positioned for the downside.
These conditions — deteriorating industry momentum, confirmed earnings contraction, technical resistance at a multi-month high, and low short interest — represent the convergence that the framework identifies as structurally significant.
The full trade structure, including entry zones, stop levels, profit targets, and time horizon, is available in the complete One Stock Report PDF linked above.
If you found this analysis useful, these are the tools behind it:
Register and receive the full 40-industry Heat Map in Excel every day — to understand the industry context behind every stock we analyse.
This report covers 1 stock. The ImGeld Fundamental Report covers the complete long-short stock universe — the best candidates across all 40 industries, delivered daily.