
When the Fuel Gauge and the Engine Read Different Things
M2 hit an all-time high. The 10-Year yield broke below 4%. Both made headlines the same week. The connection between them is worth understanding.

When the Fuel Gauge and the Engine Read Different Things
M2 hit an all-time high. The 10-Year yield broke below 4%. Both made headlines the same week. The connection between them is worth understanding.
Two macro data points landed within days of each other. Both were widely covered. What received less attention was what happens when you place them side by side.
M2 Money Supply reached a new all-time high. At the same time, the 10-Year Treasury yield dropped below 4% for the first time since November. These are not isolated readings. They are two instruments measuring the same system from different angles, and right now they are not in agreement.
M2 at record highs means there is a significant amount of capital in the system. But that capital is not moving into risk assets. It is moving into bonds. That is the part worth paying attention to.
What Each Indicator Is Saying
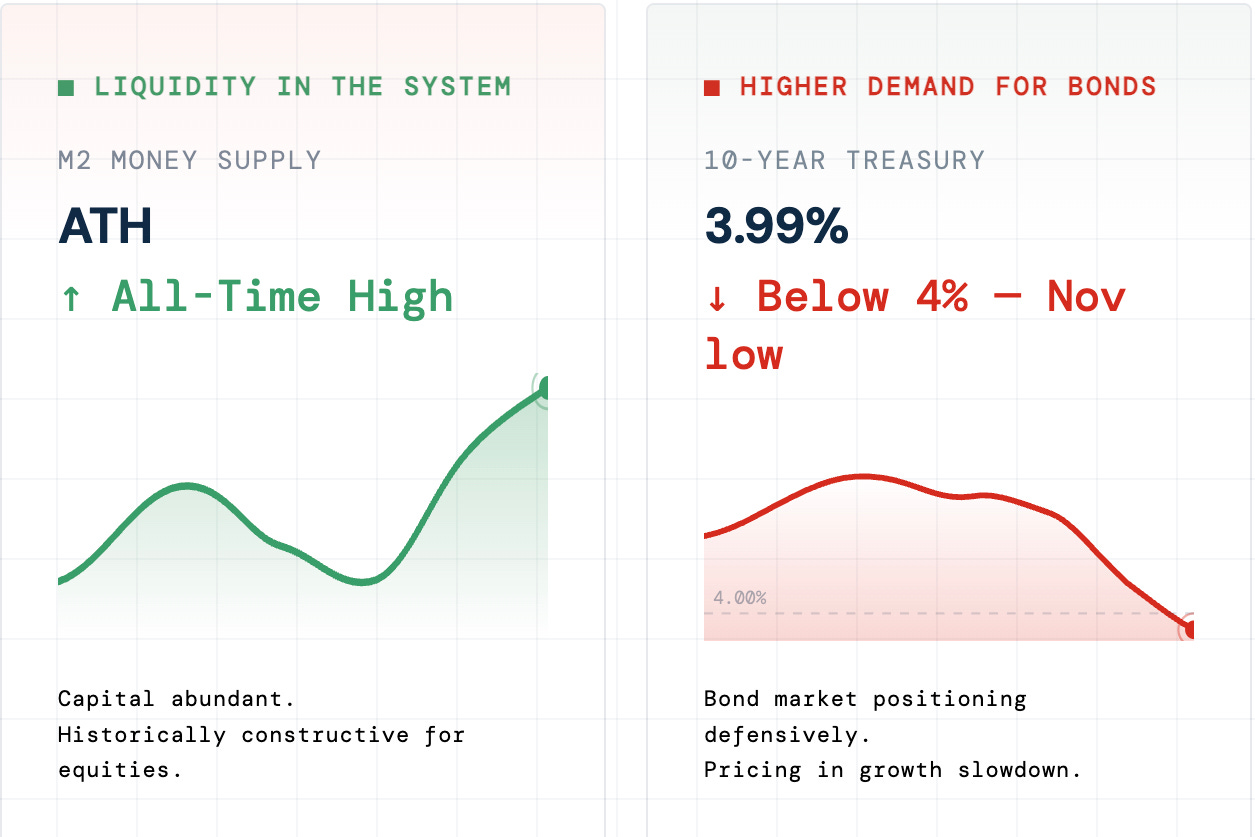
M2 captures the total amount of money available to move through the economy at short notice. When it expands, the system has more fuel. The conditions under which risk assets historically perform are, broadly speaking, present.
The bond market is saying something different. When the 10-Year yield falls, demand for long-duration government debt is rising. Institutional capital rotates into Treasuries when the growth outlook deteriorates or when the forward earnings environment looks uncertain. A yield below 4% is consistent with markets beginning to price in slower growth, potential policy reversal, or both.
Placed together, these two readings describe a system where liquidity is abundant but growth expectations may be softening. Both are real. Both reflect something about the current state of the system.
The Portfolio Implication
In environments where macro signals conflict, the appropriate response is not to increase conviction. It is to reduce it. The most common error here is acting on the signal that confirms a pre-existing view and ignoring the one that complicates it.
A few indicators are worth cross-referencing before drawing conclusions:
■ PMI readings above 50 would suggest the growth narrative remains intact
■ Credit spreads widening would reinforce the bond market’s defensive posture
■ Breadth deteriorating would indicate equity participation is narrowing
The structural tension between these two indicators suggests a period where selectivity matters more than direction. Which industries are absorbing capital? Where is relative strength holding? Those questions are more useful right now than a directional bet on the index.
Markets spend considerable time in states of ambiguity. The work is in building the full picture, not in picking the one data point that fits a narrative.
If you found this useful, ImGeld publishes market breadth and industry analysis on a regular schedule. Subscribe below.