
The index looks fine. 3,000 stocks say otherwise. Or not ?
How ImGeld uses the McClellan Oscillator to read what the market is actually doing

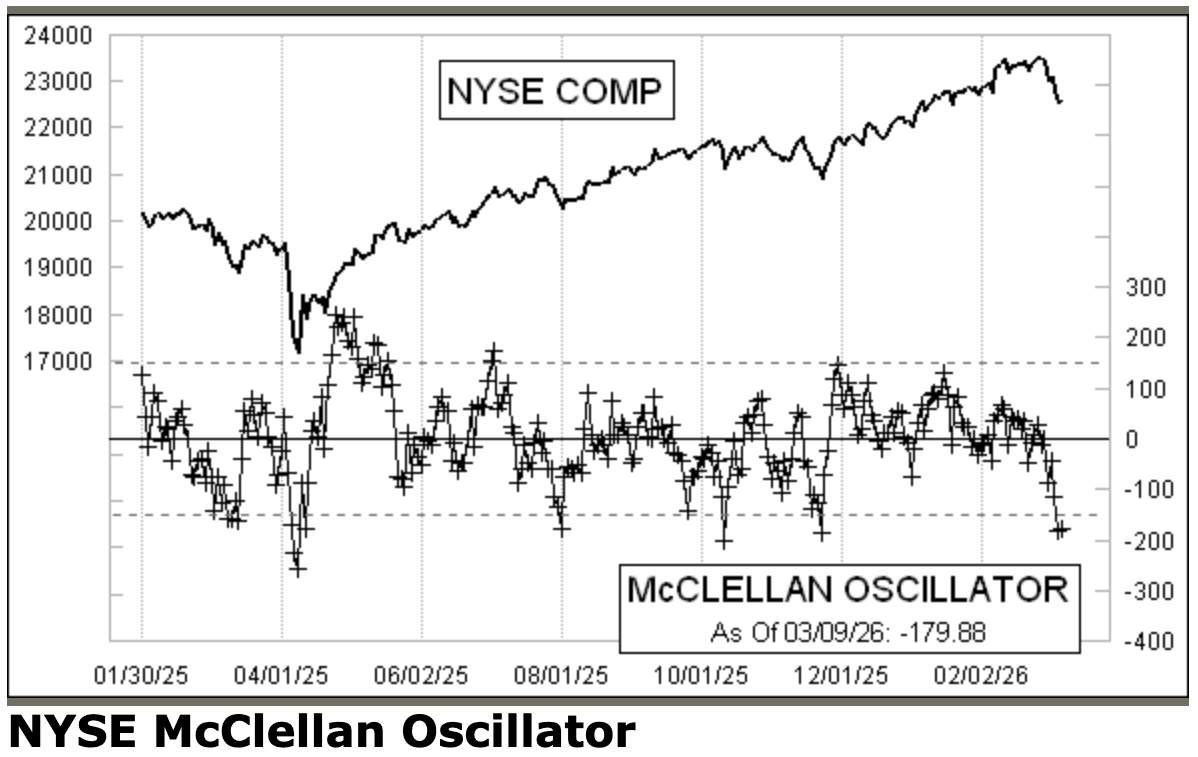
The McClellan Oscillator: participation before price
The NYSE has close to 3,000 stocks trading every day. Not the S&P 500. Not the Nasdaq 100. Three thousand companies, across every size, sector, and risk profile.
Each session, some close higher. Others lower. The difference between the two is what the McClellan Oscillator measures. A day where 1,800 stocks advance and 1,200 decline is structurally different from one where 606 advance and 2,174 decline. The index price may not reflect it. The Oscillator does.
How it works
The calculation starts with the daily difference between advancing and declining issues on the NYSE, smoothed through two exponential moving averages. The result oscillates above and below zero. When selling pressure dominates session after session, the Oscillator falls, and it can fall hard.
The -100 level functions as a structural reference. When the Oscillator drops clearly below it, broad market participation is deteriorating. What matters is what happens next. When it crosses back above -100 with conviction, participation across 3,000 stocks is recovering.
What our Market Breadth posts are tracking
Every day, ImGeld publishes a Market Breadth update covering five indicators: NYSI, NYAD, NYHGH, NYLOW, VIX and RVX. The McClellan Oscillator is the daily engine behind the NYSI, which is the cumulative version of the same signal.
When the NYSI declines five sessions in a row, as it did in the most recent update, that is the Oscillator printing negative day after day without interruption. When the NYAD records four negative sessions out of five, it confirms the same deterioration from a different angle. When new highs contract from 81 to 58 and new lows climb from 19 to 64, the breadth picture becomes consistent across every dimension we track.
No single indicator carries the post. They either confirm each other or they conflict. When they confirm, the structural read is clear. When they conflict, selectivity increases and conviction decreases.
What it means for the portfolio
An Oscillator below -100 is not a trade instruction. It is structural context.
■ Adding long exposure while participation is deteriorating means relying on a shrinking group of stocks to carry the move.
■ A recovery above -100 does not confirm a new uptrend. It indicates breadth is stopping getting worse. Those are two different conditions.
■ In a long-short context, sustained negative readings are consistent with short exposure in crowded leadership finding more structural support.
The most common mistake is treating the absolute number as a signal. Patience and confirmation matter more than reacting to a single reading.
Process over prediction
The daily Market Breadth post exists for exactly this reason. Not to call direction. To track whether the structural conditions that support disciplined long exposure are present or absent, and to do so consistently, session after session.
Simple tools work well when used with discipline. Breadth, measured consistently and read with patience, remains one of the most honest inputs available.
Further Reading
NYSE Daily Breadth Data Archive -- https://www.nyse.com/data/transactions-statistics-data-library