
BIG in JAPAN
A signal not seen since 2005 is flashing. Here’s what it means for global markets

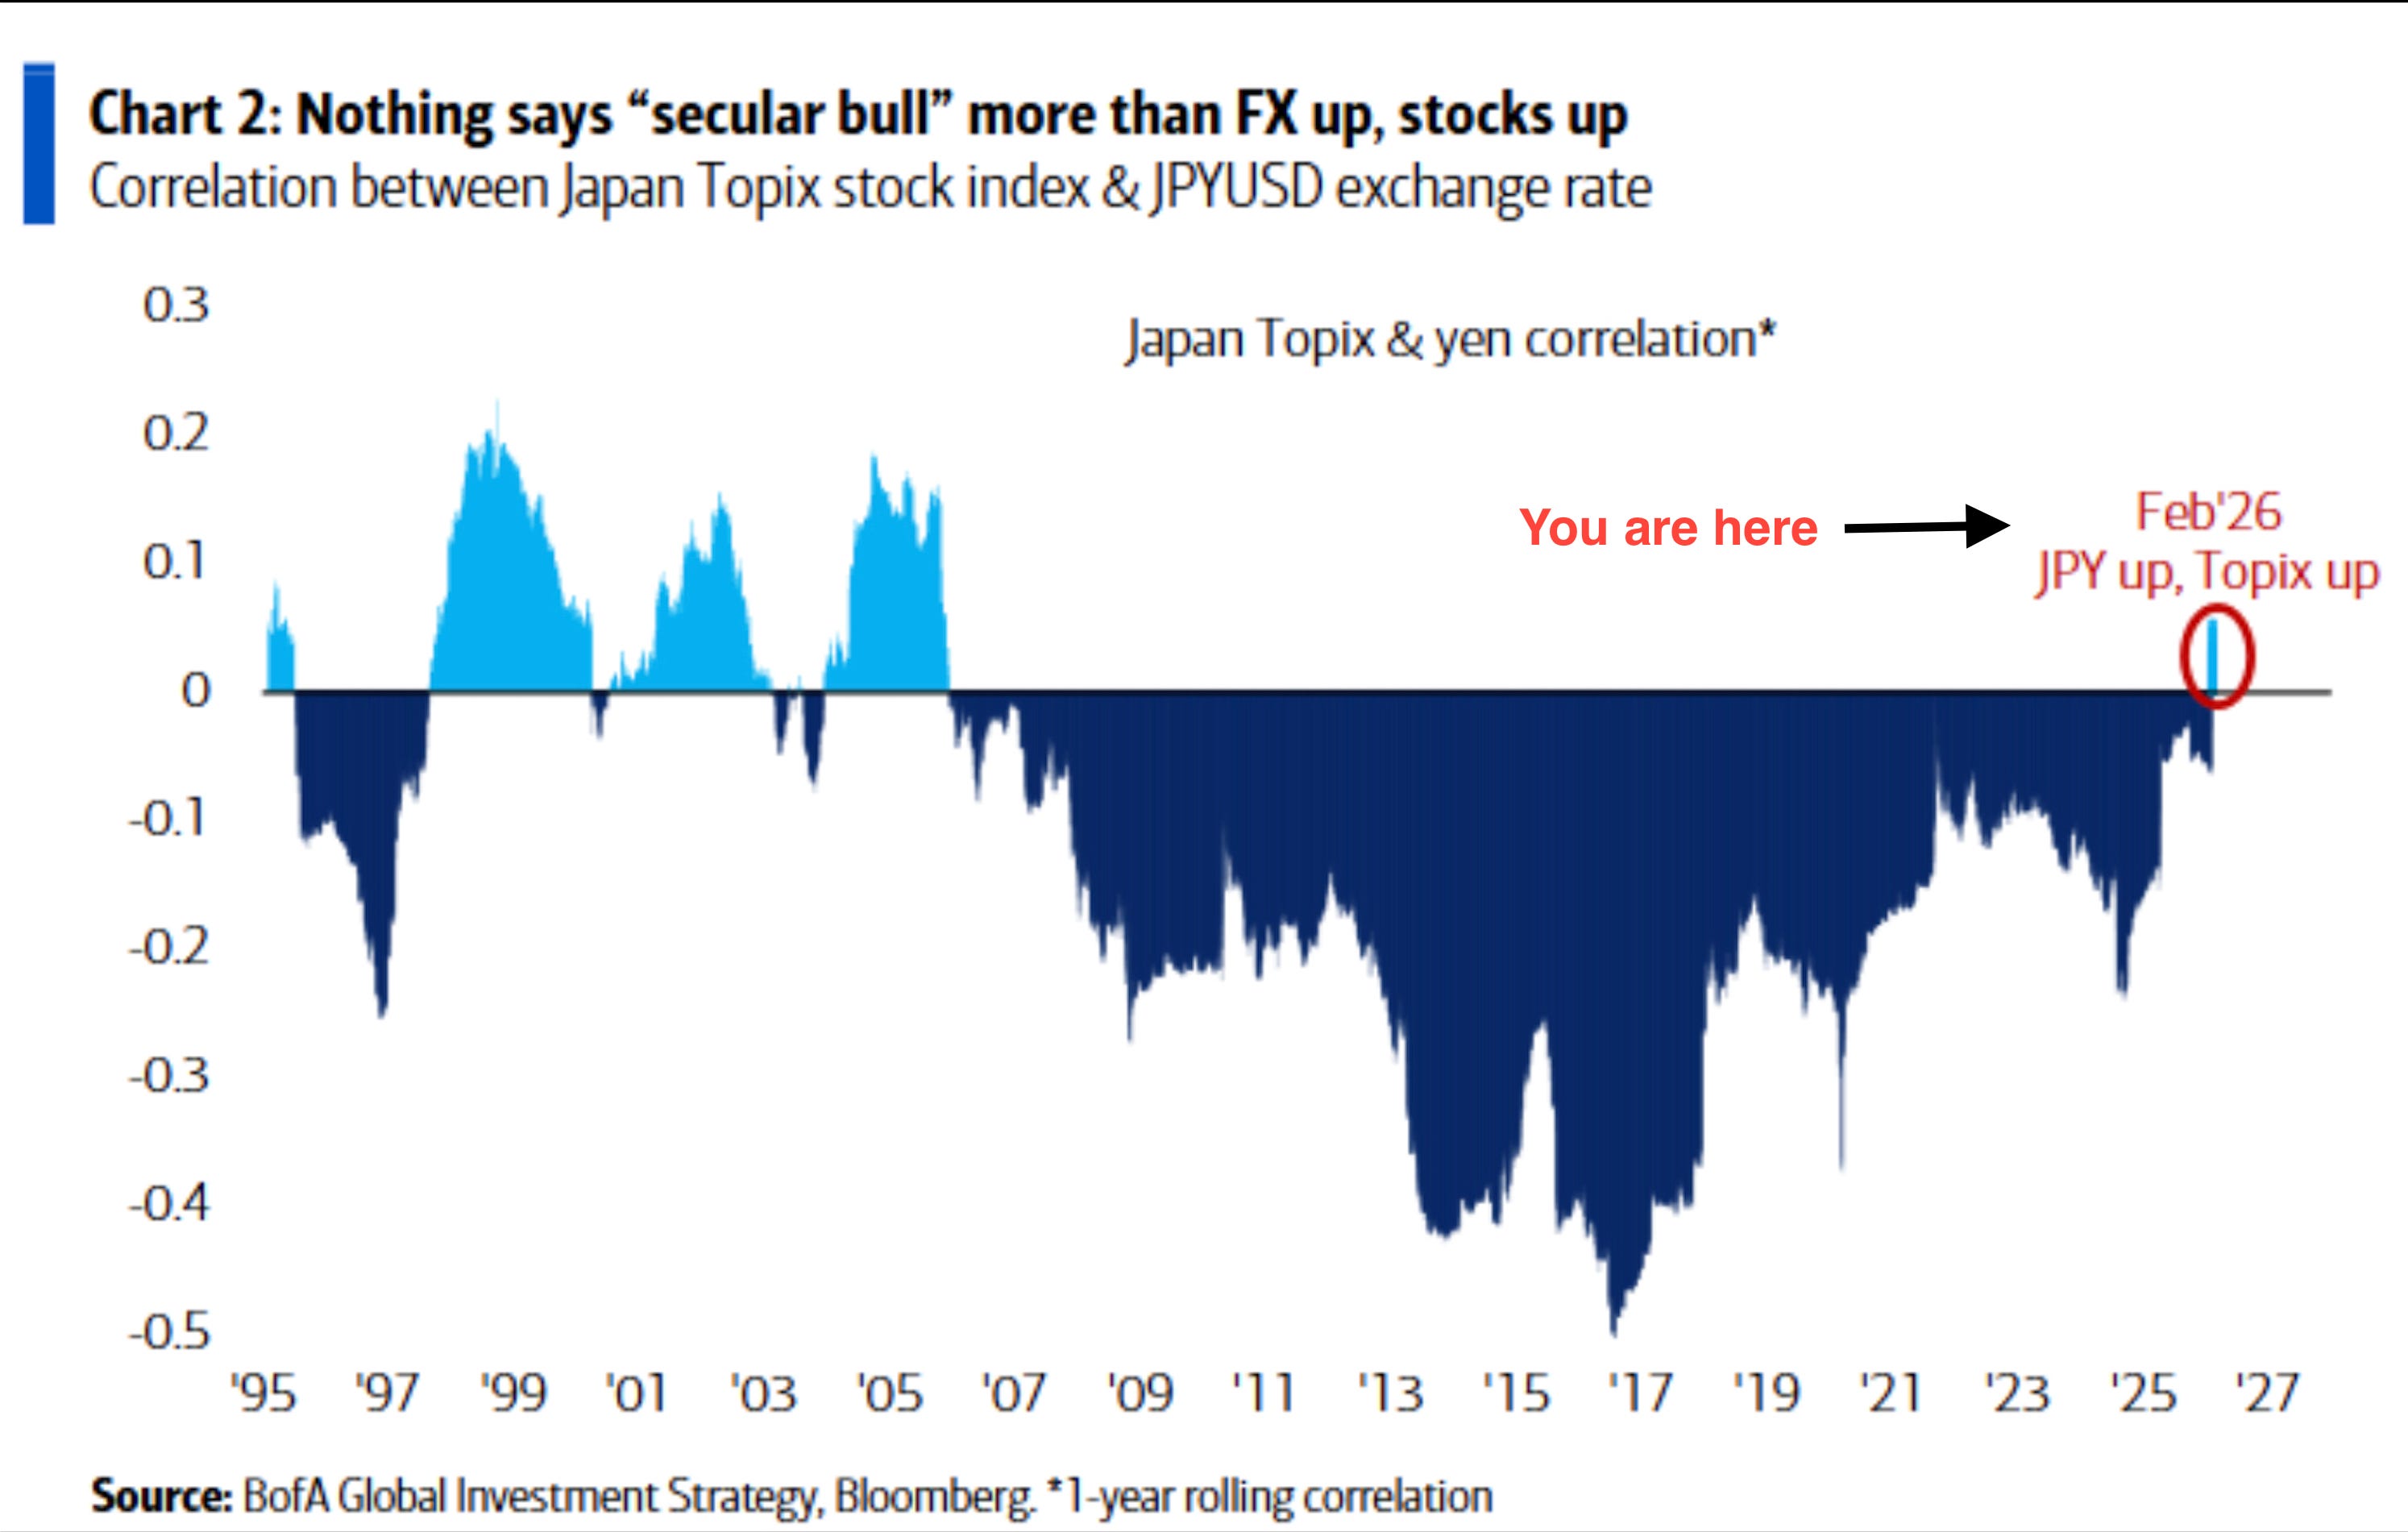
The Yen-Nikkei Correlation Just Flipped Positive
The 1-year rolling correlation between the Japanese yen (JPY/USD) and the Topix stock index has turned positive for the first time since 2005. This is a major structural shift highlighted by Michael Hartnett, Chief Investment Strategist at Bank of America, in his latest Flow Show report.
For the past two decades, the relationship between the yen and Japanese equities has been consistently negative: when the yen strengthened, stocks fell, and vice versa. Export-heavy Japan thrived on a weak currency. That paradigm appears to be breaking.
Why This Matters: The “Secular Bull” Signal
Hartnett frames it bluntly: nothing says “secular bull market” more than a rising currency paired with a rising stock market.
This is not a theoretical observation. History provides powerful precedents:
Japan (1982–1990): The yen appreciated significantly against the dollar while the Nikkei surged from ~7,000 to nearly 39,000. Foreign capital flooded in, attracted by both currency gains and equity returns. The result was one of the greatest bull markets in history.
Germany (1985–1995): The Deutsche Mark strengthened substantially during the post-reunification boom. The DAX delivered outsized returns as Germany became Europe’s economic powerhouse, with currency and equity appreciation reinforcing each other.
China (2000–2008): The yuan’s gradual appreciation coincided with the Shanghai Composite rising from ~1,000 to over 6,000. China’s integration into global trade created a virtuous cycle of capital inflows, currency strength, and equity gains.
In each case, the dual signal of “FX up + stocks up” marked the beginning of a multi-year secular bull market, not a temporary blip.
The Short-Term Pain: Deleveraging Pressure
But here’s the tension that most commentators miss — and this is where ImGeld’s industry-level analysis becomes critical.
A strengthening yen in the short term is not uniformly bullish. In fact, it intensifies deleveraging pressure across several asset classes and industries. Here’s why:
The yen carry trade has been one of the largest sources of global liquidity for decades. Investors borrow in yen (cheap funding) and invest in higher-yielding assets worldwide. When the yen strengthens, those positions get squeezed. The borrowed currency becomes more expensive to repay, forcing liquidation of the assets purchased with those borrowed yen.
This dynamic puts direct pressure on crypto, silver, private equity, software, and energy — all sectors that have benefited disproportionately from cheap yen-funded liquidity.
A disorderly yen rally — particularly JPY breaking below 145 against the dollar — would be the equivalent of pulling a liquidity drain on global risk assets. Every major deleveraging episode in recent history has coincided with yen strength: August 2024, March 2020, Q4 2018.
What We’re Watching at ImGeld
This is exactly the type of cross-asset, macro-to-industry dynamic that our methodology is designed to capture.
At ImGeld, we track all US industries daily, scoring them on fundamental momentum. When macro forces like yen strength create sector-level dislocations, our All US Industries Momentum Heat Map identifies which industries are absorbing the pain and which are benefiting — showing you exactly where to look for long and short positions.
Right now, the industries most exposed to yen carry trade unwinding are precisely those that rode the liquidity wave hardest: speculative tech, high-multiple software, crypto-adjacent plays, and leveraged energy positions.
Meanwhile, industries with domestic revenue bases, pricing power, and low foreign capital dependency tend to outperform during deleveraging episodes.
The question isn’t whether the yen-Nikkei positive correlation is bullish — it is, structurally. The question is whether the transition happens orderly or disorderly.
The Bottom Line
The positive yen-Nikkei correlation is a secular bull market signal. History suggests Japan may be entering a new bull market regime where both currency and equities rise together, attracting global capital flows.
But secular shifts don’t happen in straight lines. The short-term deleveraging risk from yen strength is real and will create winners and losers at the industry level.
If you want to know which US industries are positioned to benefit — and which are at risk — from this macro shift, subscribe to ImGeld and get our All US Industries Momentum Heat Map delivered to your inbox.
We don’t guess. We track.
Source: BofA Global Investment Strategy, Michael Hartnett — “The Flow Show,” February 2026. Chart data from Bloomberg.
Want the full picture? Subscribe to ImGeld and receive our All US Industries Momentum Heat Map — the tool that tells you exactly where to go long and where to go short, every single day.